Normal Study
MAG3 Study
General
Tracer = Tc-99m-MAG3
Dose = 0.1 mCi/kg
1 frame every 15 seconds for 20 minutes
Furosemide 1.0 mg/kg (max of 40 mg)
Minimal radiation dose (less than a CT)
When looking at renal artery stenosis
Hold ACEi for 2-5 days prior to exam
Give 25 mg captopril (oral 1.0 mg/kg) not to exceed 50 mg
Give 300-500 ml of water
Analysis
3 Things to look at basically
Cortical/Parenchymal phase (60-120 seconds)
Look at uptake, shape, size, location, total and split function
Transcortical Transit Time
This is the time from tracer injection to the pelvicalyceal system
Normal = 2-5 minutes
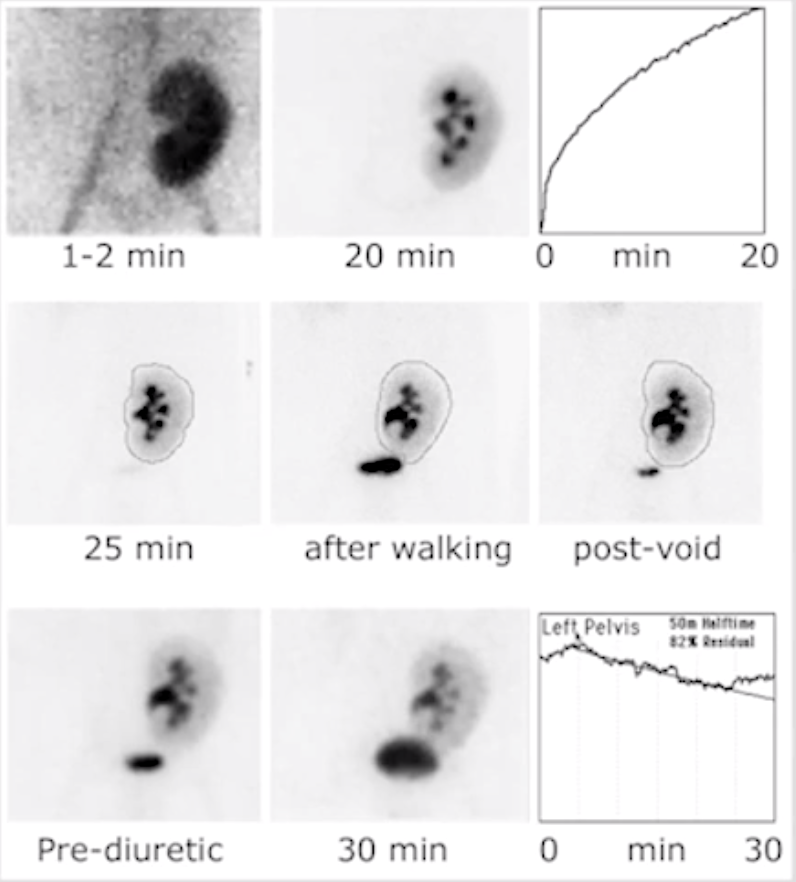
Drainage Phase
Image and time-activity curve analysis
When looking at renal artery stenosis, an abnormal study is characterized as
Increased split differential uptake
Increased cortical transit time
Retention of tracer in renal parenchyma
When you give captopril to a pt with RAS the MAG3 clearance will decrease (when given to patient with normal renal function MAG3 clearance will increase)
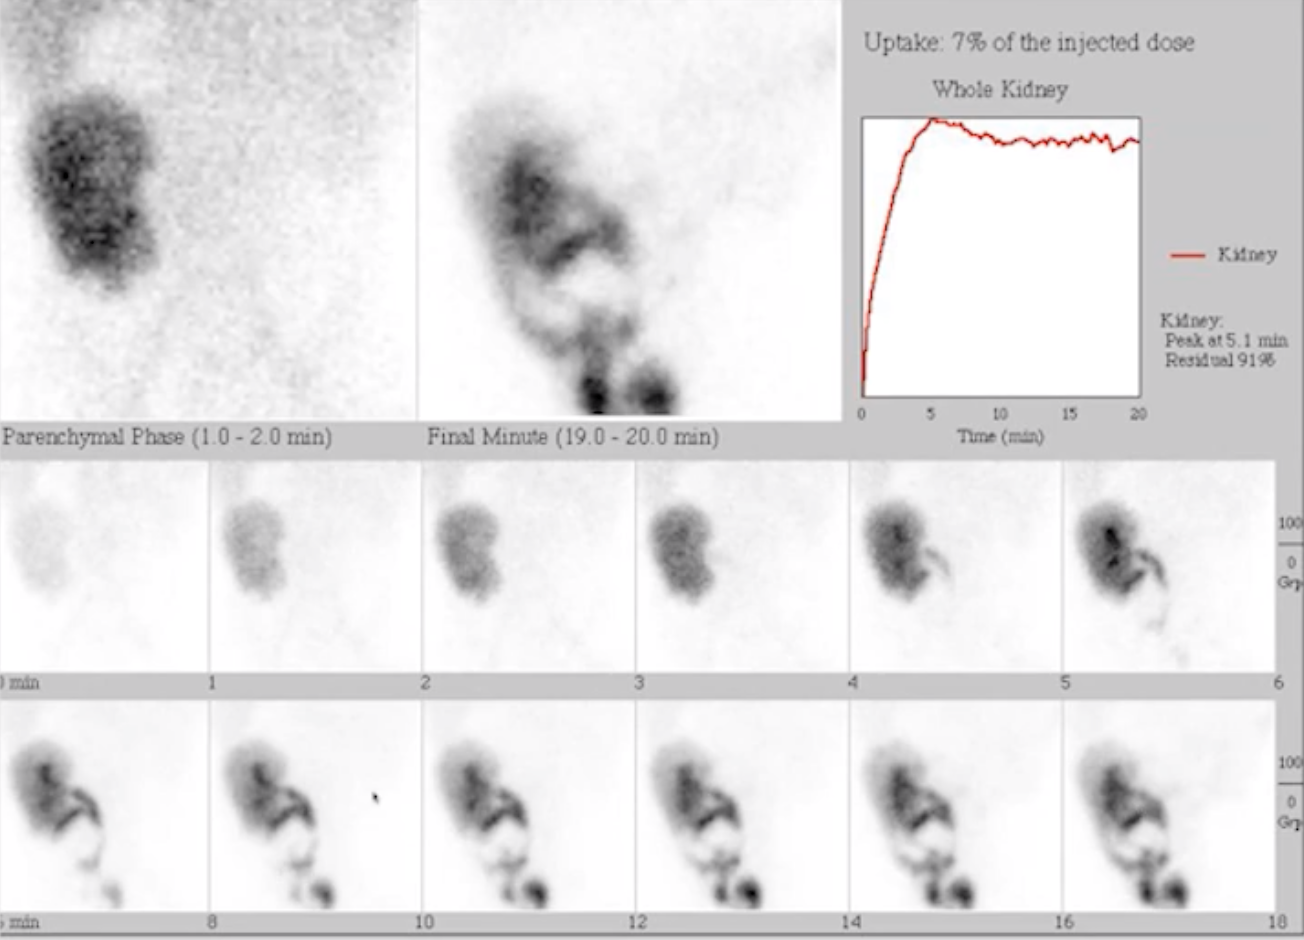
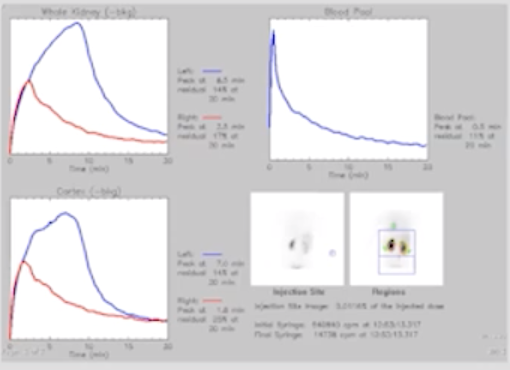
For our reports at UH it asks to report the T1/2 clearance
To get this you need to look at the time at which it is Tmax and look at the counts on the left (Y axis)
Go to the time on the X axis where the counts are half of the Tmax
Then subtract the time where it is T1/2 from the time at Tmax
Normal is < 10 minutes
Equivocal is 10-20 min
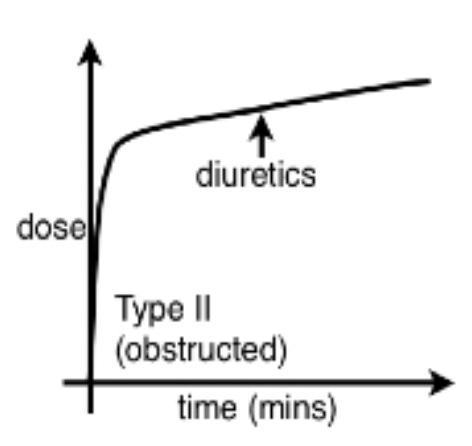
Evidence of obstruction = > 20 min
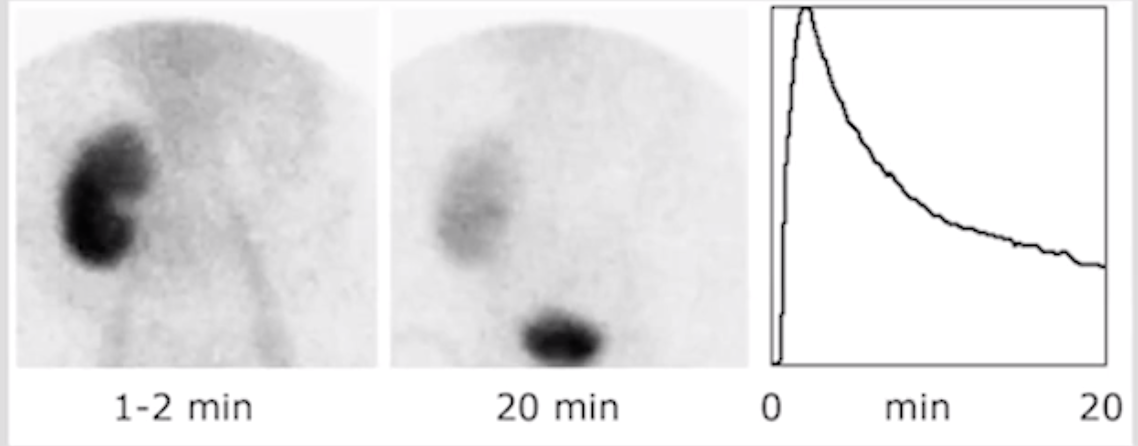
Normal Study
Delayed clearance
May be seen with obstruction
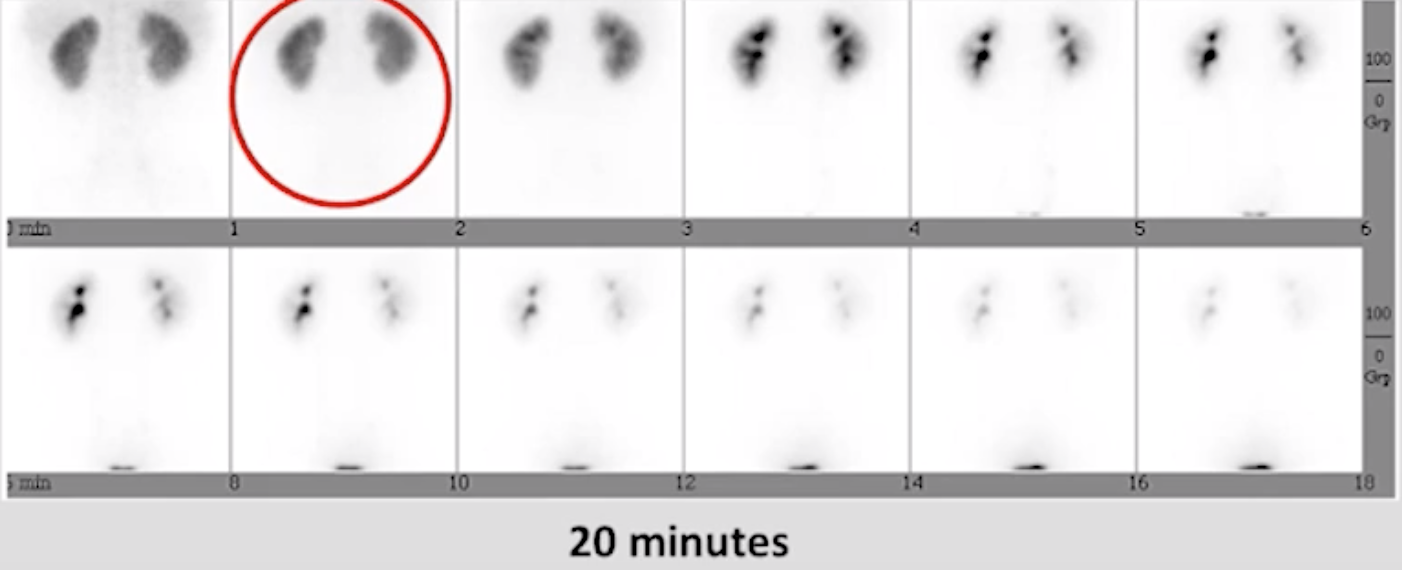
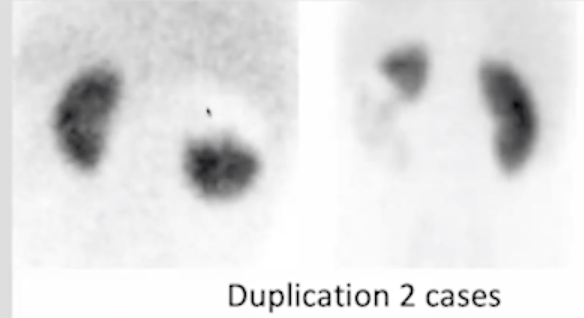
Duplicated Collecting System
Basically half kidney is photopenic
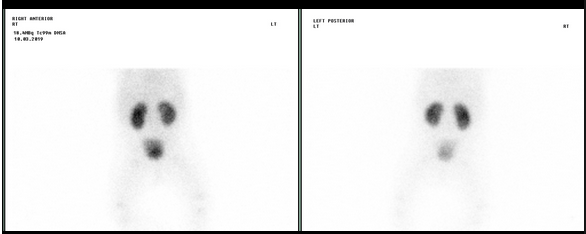
Super-Renal Function
Basically rapid uptake and excretion
Nothing worrisome
References:
Renal Scintigraphy
General
Dynamic used to evaluate
Renal perfusion (renal artery stenosis)
Obstruction
Evaluate renal function / transplant
Will have tration of trous dynamic imaging for 30 minutes
Static used to evaluate
Renal cortex
Imaging taken 2 hours after adminis
3 Types
MAG 3 —> Dynamic —> secreted by proximal tubule —> cannot determine GFR —> high renal extraction from blood —> better pics
Tc-99 DTPA —> Dynamic —> secreted by glomerulus —> can determine GFR —> lower renal extraction from blood —> worse pics
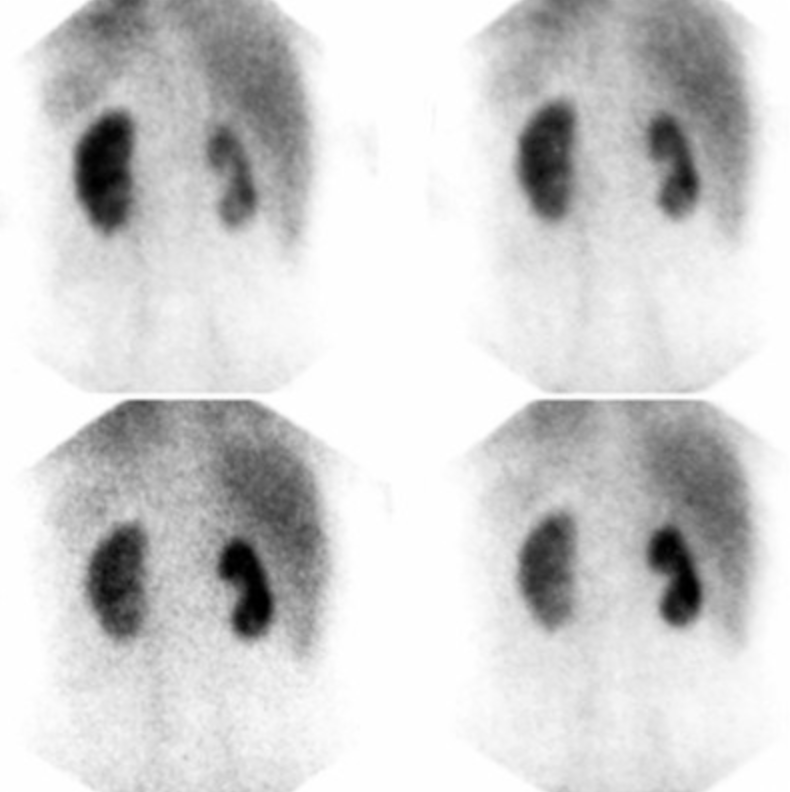
Tc-99 DMSA —> Static
Renal Artery Stenosis
Right kidney is smaller and shows delayed uptake and retention = RAS
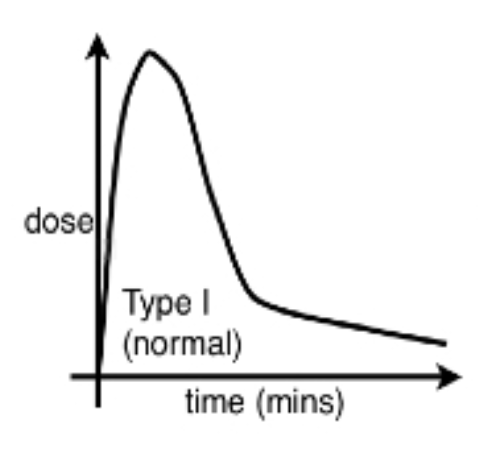
Abnormal Study
Delayed time to peak
Blue line on left - notice wider and later peak than the normal red line
Associated with RAS
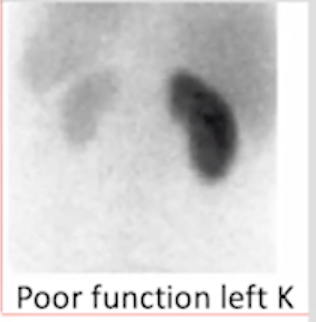
Poor Renal function
Asymmetric poor uptake
Renal Obstruction S/p transplant
Good uptake but retained tracer that is not cleared
Abnormal curves
Tc-99m DTPA
Tc-99m DMSA
General
Used to evaluate renal cortex, such as for:
Renal scarring (vs pyelo)
Pinhole collimator or SPECT used to image
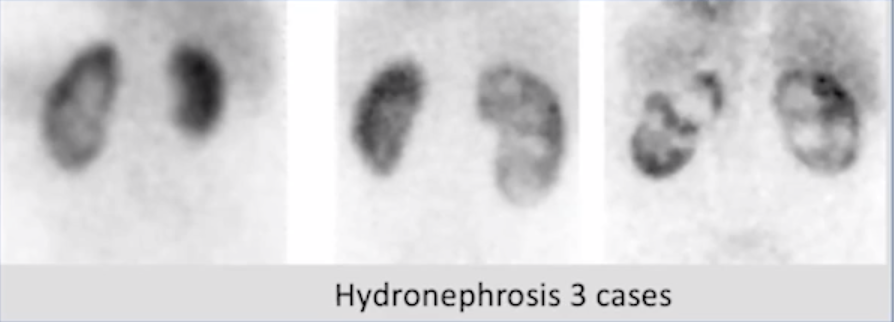
Hydronephrosis
Looks like odd photopenic areas
Urinary Leak
Tracer outside the kidney and collecting system