MR Elastography
Step 1:
Open the study and read through the sequences like normal, looking at T2, T1, in and out of phases
Step 2: Fat Fraction (FF)
Find the sequence that allows you to scroll through 4-5 different sequences in one box if you keep scrolling - this is usually 4th to last
Usually names METABOLIC mDixon Quant BH
The sequences you scroll through will usually be the ones that come after it in the pacs line including the
smDIXON Quant BH FF
smDIXON Quant BH T2*
smDIXON Quant BH R2*
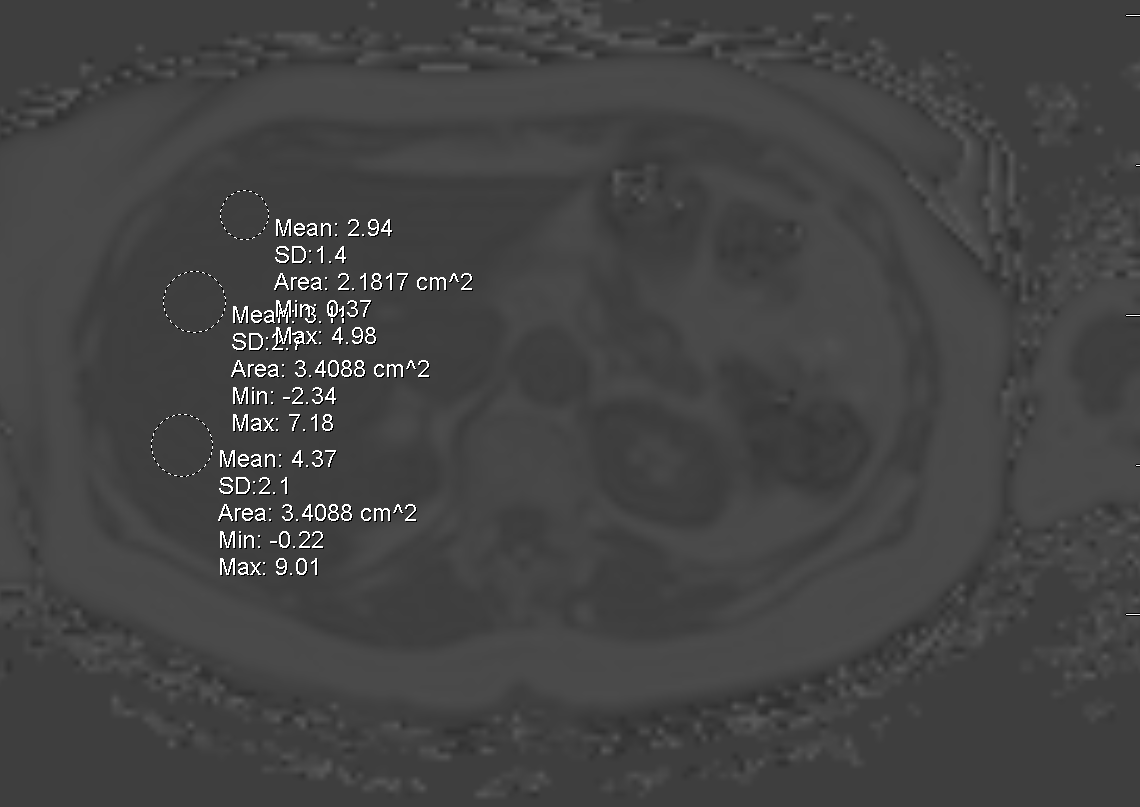
Now when you scroll through it you want to look for the one that looks like the smDIXON Quant BH FF
The image to left is windowed so you can see it but will look like this probably just a little darker but fat should be bright and liver somewhat dark
You now need to draw 3 ROI in the liver on 3 different slices (9 total)
The values should be in the 2-30 range, if youre getting 100+ youre in wrong sequence
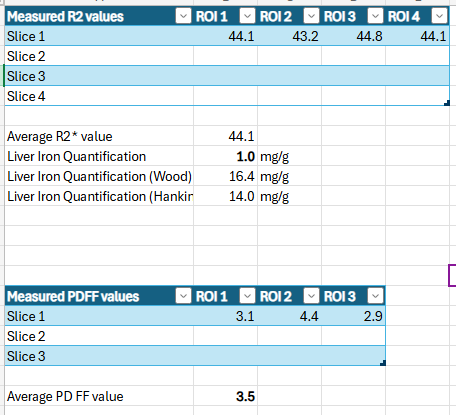
Now put these values into the XCel sheet in teams in peds folder under “liver iron concentration worksheet” at the bottom where it says PDFF values
Take the average value and plug it in under your PDFF value
Step 3: Iron levels
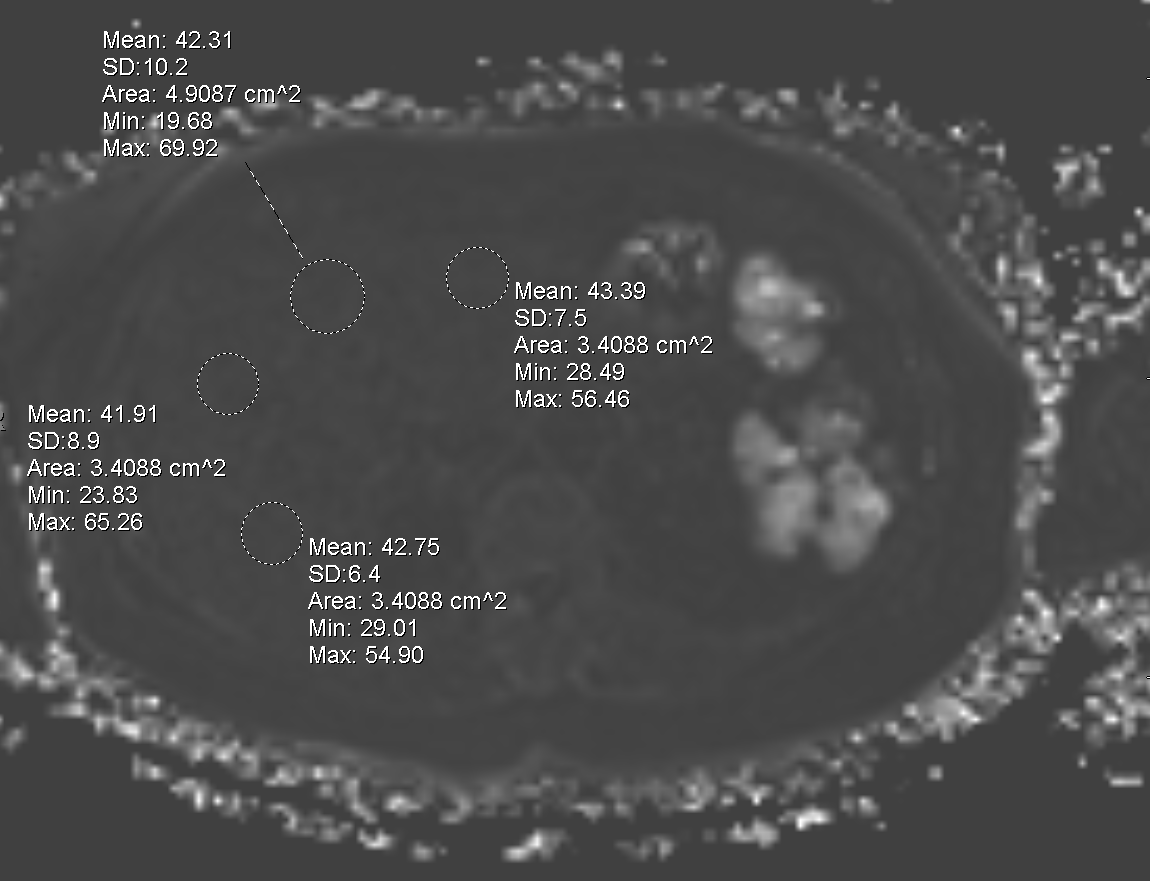
Keep scrolling on the one series that has multiple linked together until you get to the one that looks like the R2 map
It looks hella dark, hard to actually see liver borders tbh
Drop 4 ROI on 4 different slices (16 total)
These values should be in the 40 range normally
Put the ROI values in the XCel sheet at the top labeled “Measured R2 values”
This will automatically give you a liver iron quantification below it
Use the first liver iron quantification (not the wood or hankin one)
Put that value in the template
There is a dropdown for you value whether it is normal or not
Step 4: The actual elastography part
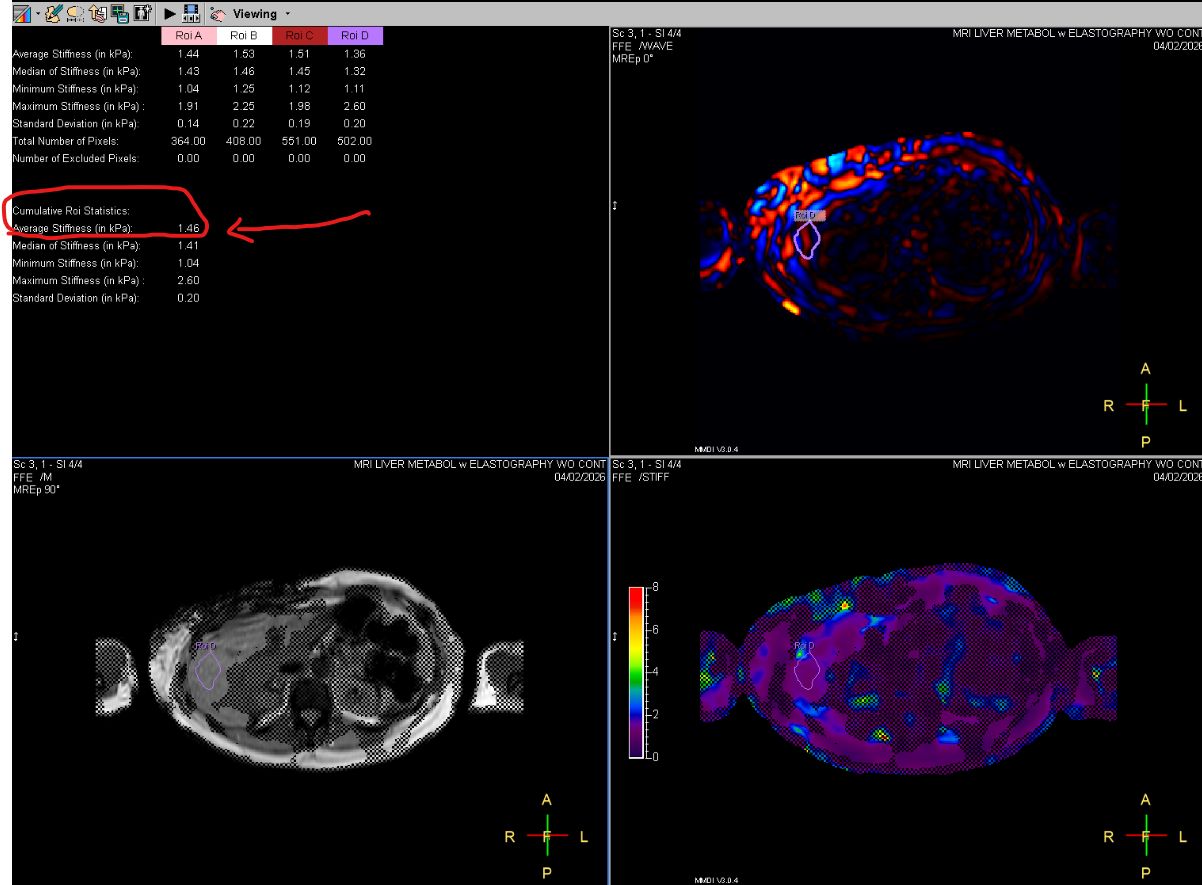
The techs should have placed 4 ROI while they were scanning them and it should give you 4 pictures that look like this —>
Use the last one that has all 4 ROI on it
If they did not do this then you’ll have to call them to do it or do it yourself (idk how)
Look for the average stiffness value given at bottom (circled in red in pic to left)
This is what you put in the template for “Average cumulative hepatic stiffness”
Ref