Liver MRI + Masses
Hemangioma
Disorganized mass of blood vessels ultimately supplied by the hepatic artery
Commonly peripheral in liver
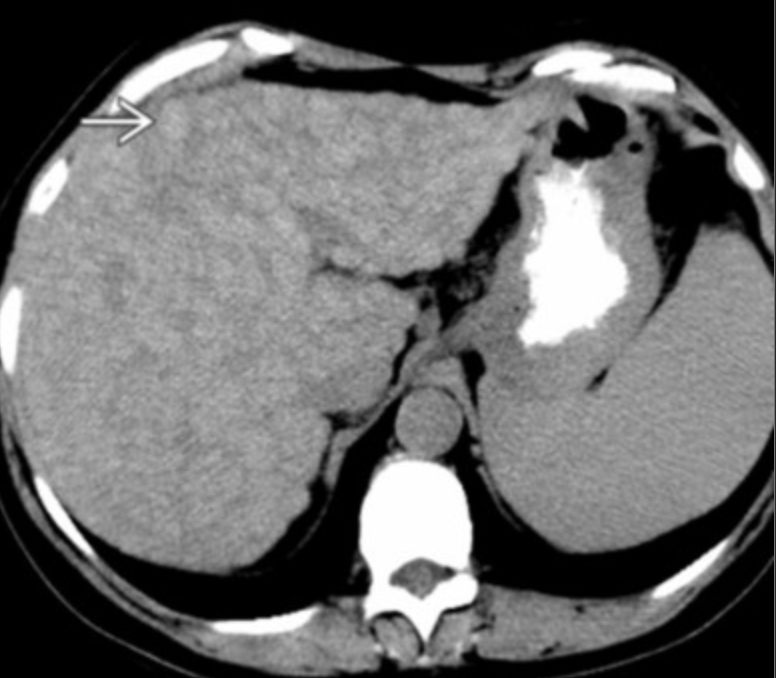
CT = non-specific hypoattenuating liver mass
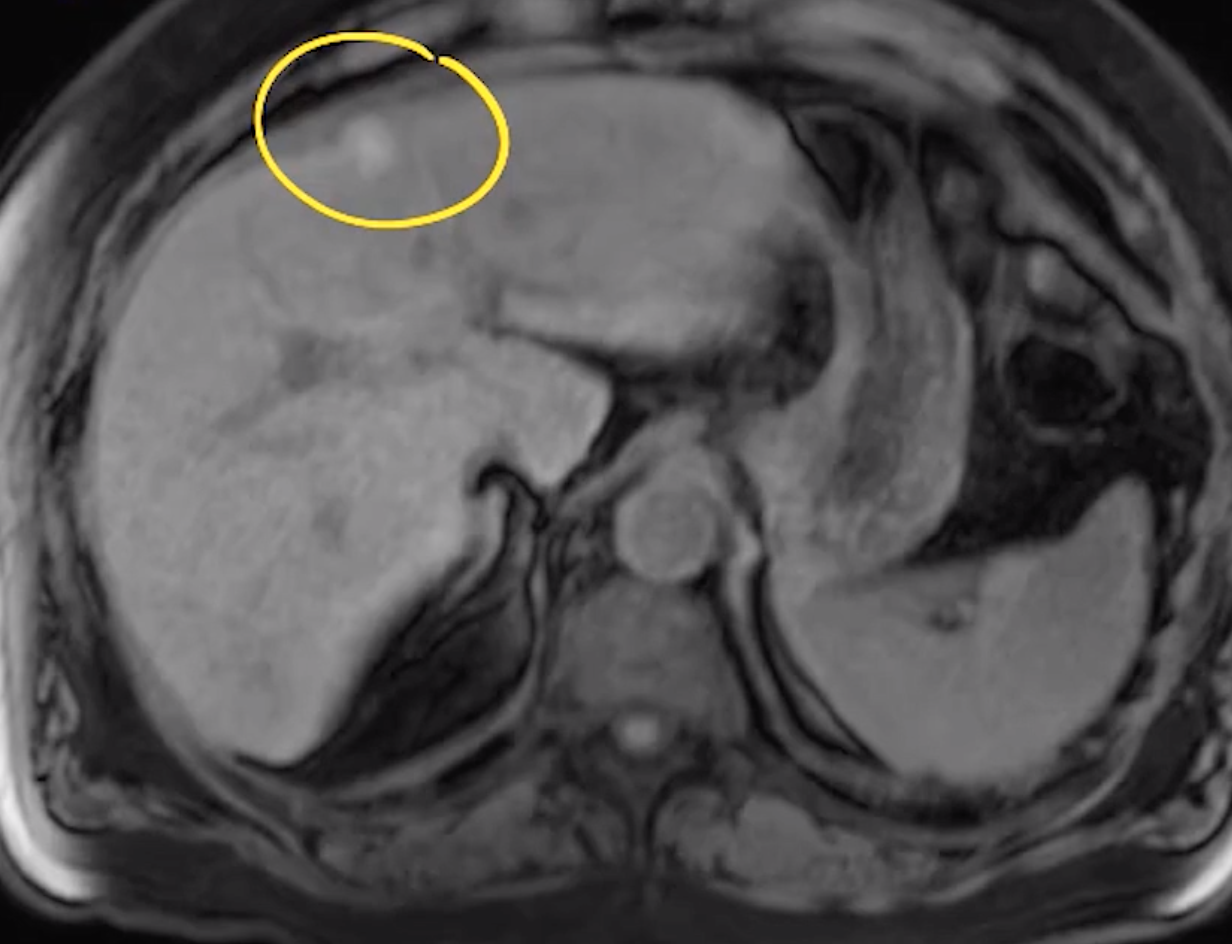
T1: hypointense (relative to liver parenchyma)
Can be mildly hyper
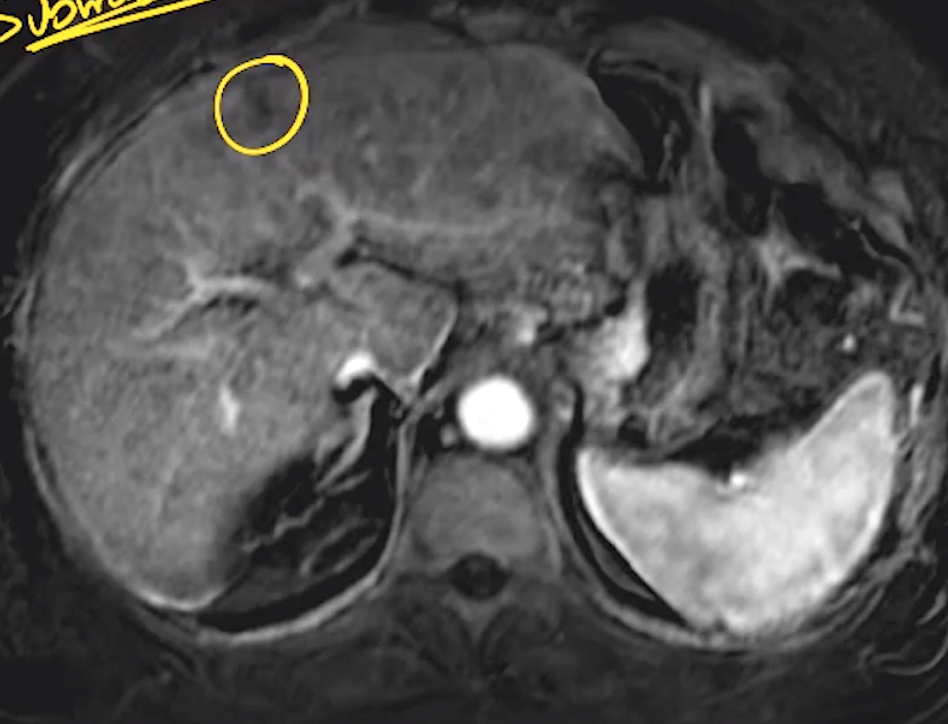
T2: hyperintense (relative to liver parenchyma)
T1 C +: peripheral nodular discontinuous enhancement with centripetally filling
Retain contrast on delayed sequences
Involute in cirrhosis
Hemangiomatosis - tons of hemangiomas
Causes highoutput HF in kids
No real issues in adults
Giant hemangioma = > 5 cm
Bile Duct Hamartoma
aka von myenbeurg complex
Cluster of disorganized bule duct
Presentation
Simple cyst or
Solid enhancing nodule secondary to fibrous tissue
Concurrent intermediate signal on T2
Seen in Caroli Disease
Cirrhosis
Segments undergoing hypertrophy 1, 2, 3
The others undergo atrophy
Caused by differences in portal venous flow with some areas having supply compressed and cut off by the fibrosis seen in cirrhosis
Liver Masses
Cystic Masses
General
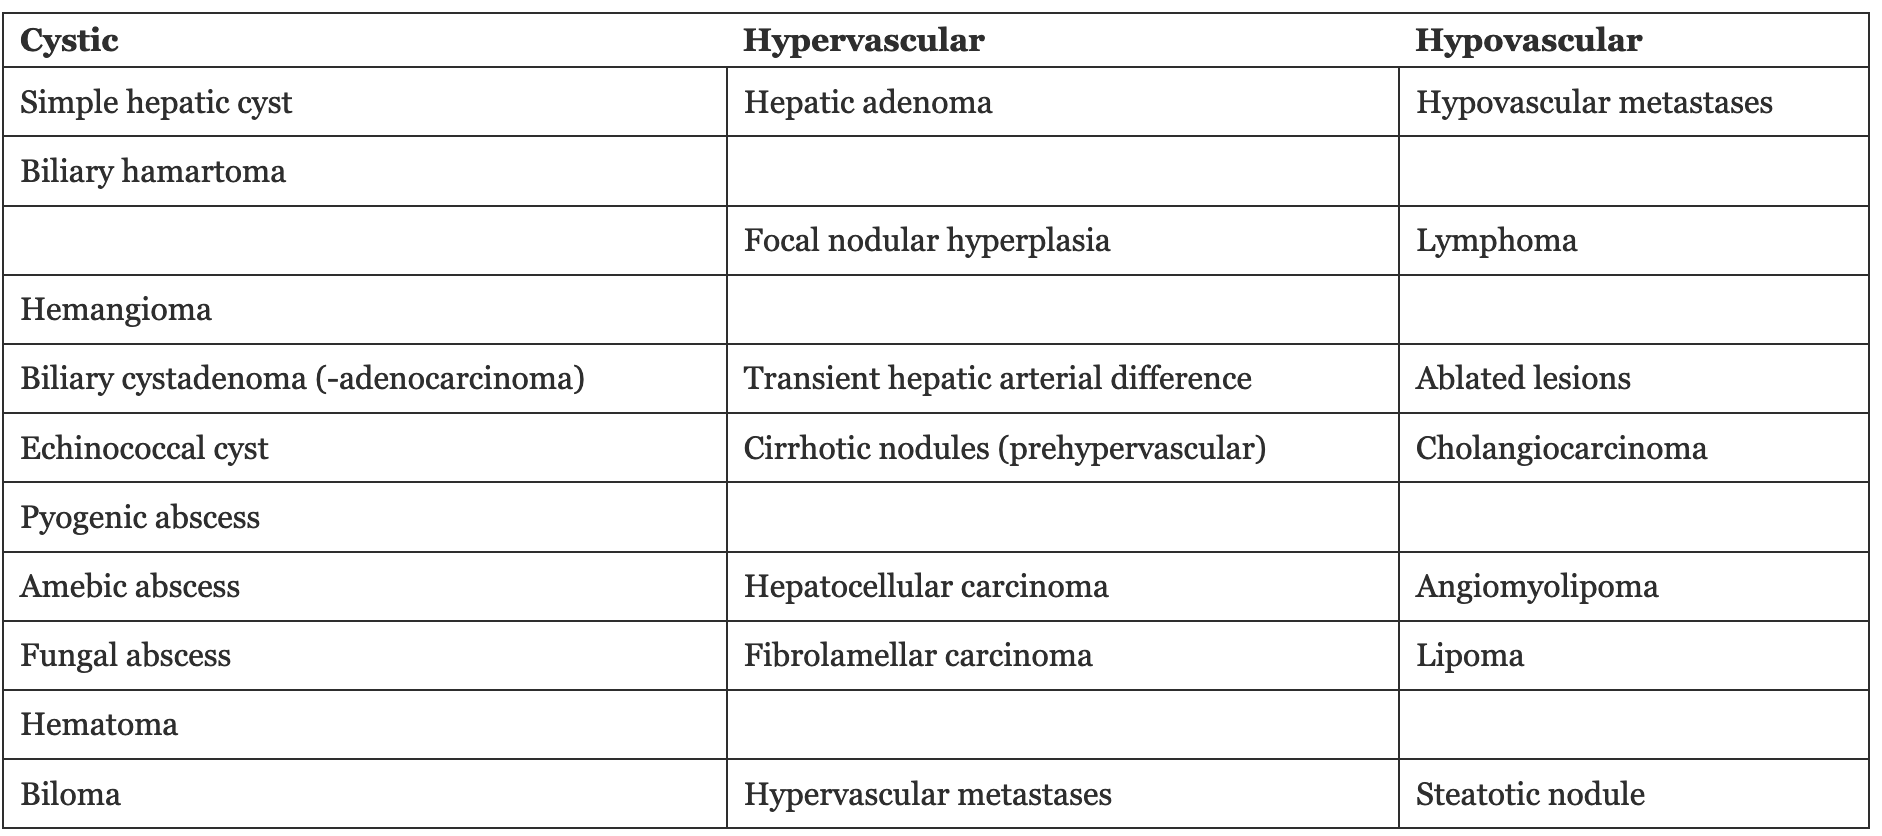
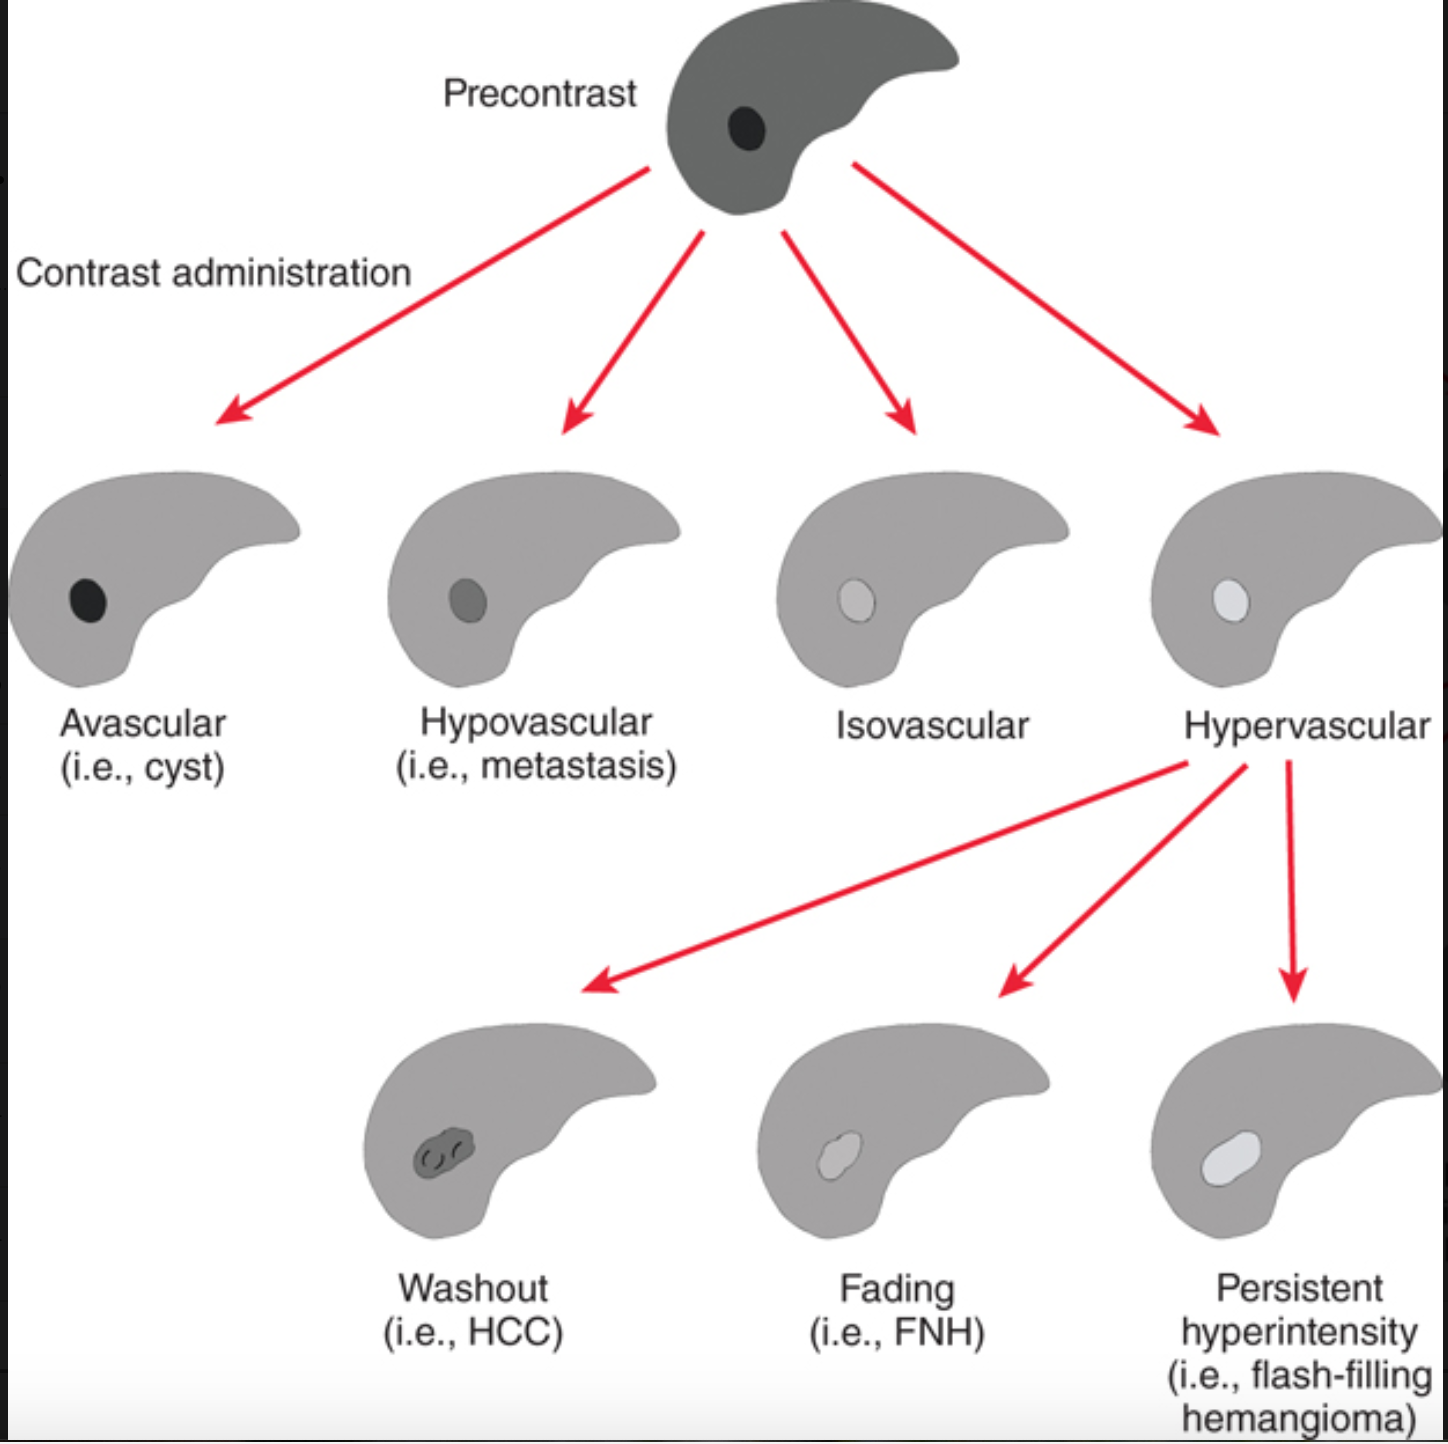
Broadly speaking there are 4 types of liver masses
Cystic
Typically all benign except for cystadenocarcinoma
Infectious
Pyogenic abscess
Amoebic abscess (entamoeba)
Fungal Abscess
Post-traumatic
Hematoma
Biloma
Solid
Benign
Adenoma
FNH
Hemangioma
Malignant
HCC
Benign masses are typically cystic without enhancement
Arterially enhancing masses that remain hyperintense or become isointense tend to be benign
Echinococcal Cyst
Cystic, multiloculated lesion
Classic T2 hypointense rim
Stage 1 - simple appearing cyst
Stage 2 - multiloculated cyst with internal smaller cysts
Stage 3 - Wall calcification & eventually complete calcification
Stage 4 - cyst rupture or complication
Don’t biopsy these, causes rupture and anaphylaxis
Serology to diagnose
Water lily sign
Fat & Water Related Artifacts
Type 1 chemical shift
Only occurs in frequency encoding direction
Worse with
high field strength
More noticeable at a narrower receiver (readout) bandwidth
Seen with
Spin echo
Gradient echo
Type 2 chemical shift - india ink
Dropout occurs on opposed phase
Only seen with gradient echo
Gradient echo has a 180 degree rephasing pulse
This is like re-starting the race between the fat and skinny guy so that the skinny guy cannot really get ahead of the fat guy
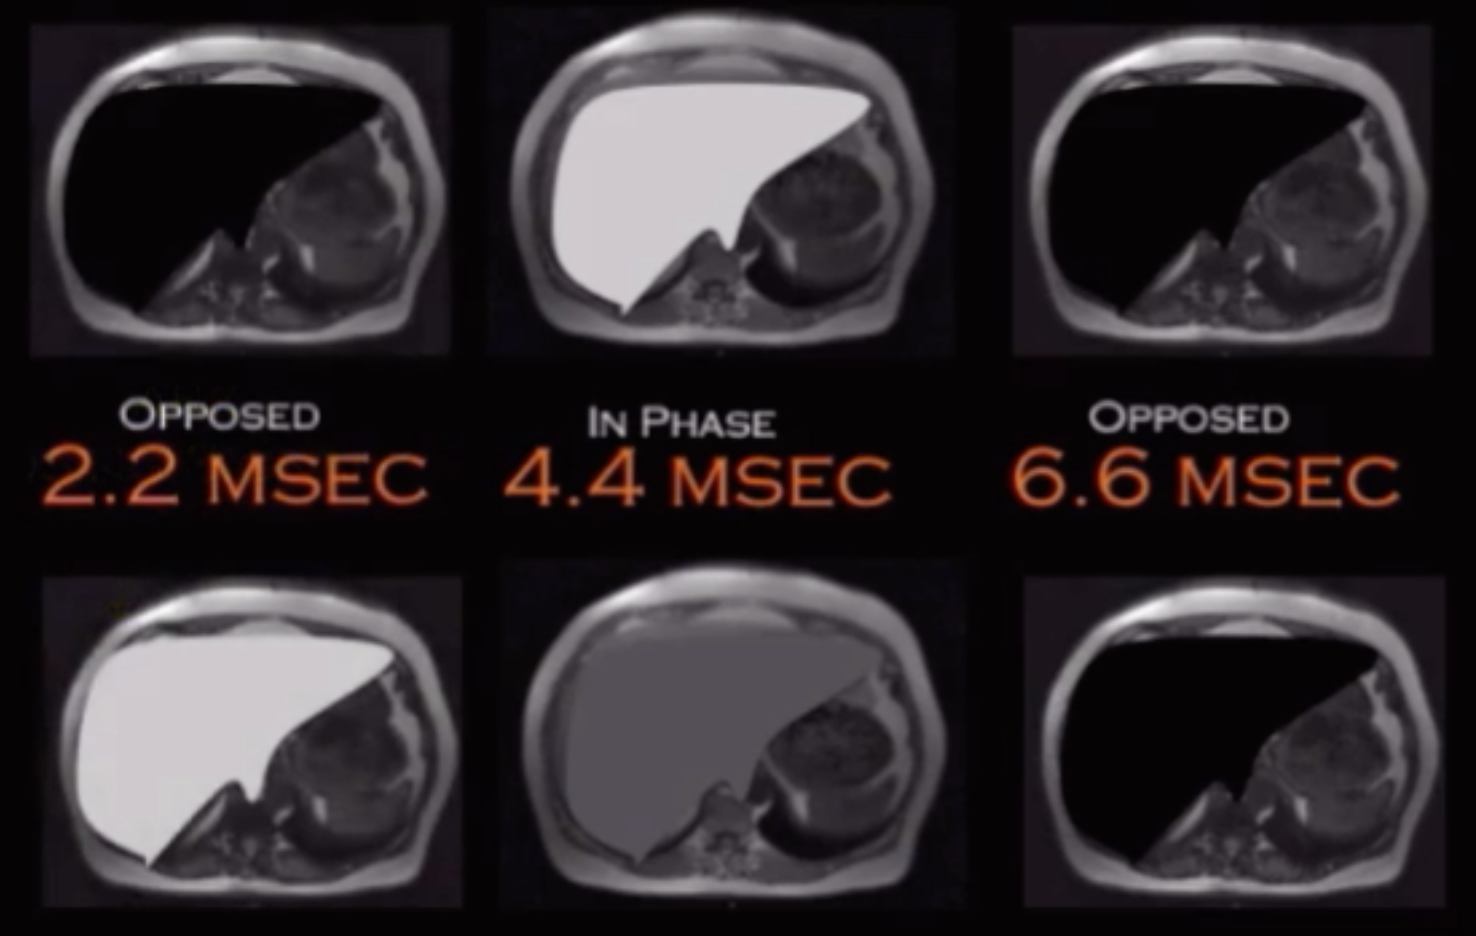
Fat and water are opposed and cancel signal - out of phase - occurs at 2.2 msec, 6.6, etc
Fat and water are aligned - in phase - occurs at 4.4 msec
Signal gets darker on out of phase = dropout on out of phase = fat (steatosis)
Signal gets brighter on out of phase = dropout on in phase = hemochromatosis
Key Note
The cycle of oppose and aligned phases will constantly continue to cycle indefinitely, so the water and fat will be opposed at 2.2, then aligned at 4.4, then opposed at 6.6 and so on
Now typically this doesn’t matter much but the following should be noted:
For a fatty liver the liver will be:
Dark on out of phase at 2.2 msec
Bright on in phase at 4.4 msec
Dark on out of phase at 6.6 msec
For an iron containing liver (hemochromatosis), the liver will be
Bright on out of phase at 2.2 msec
Dark on in phase at 4.4 msec
DARKER on out of phase at 6.6 msec
SO - you cannot really tell the difference between a fatty liver on a 6.6 msec out of phase an dan iron containing liver on the 6.6 msec out of phase
This is the reason why the OPPOSED (out of phase) 2.2 msec must be done first !
Note that for testing purposes the same phenomenon (gets progressively darker rather than dark-bright-dark-bright) will be seen with air (anywhere, i.e. in the bowel), metal clips (chole clips)
And remember that the brightest structue (brightest clips) = worst artifact = image obtained first (because they get progressively darker)
Water
Spins fast
Long T1 relaxation time
Fat
Spins slowly
Short T1 relaxation time
Key formula
Frequency = field strength x Y
Increased field strength (3T scanner rather than 1.5T magnet) will worsen artifacts
Differences in frequency are less noticeable at a high bandwidth
Some charts and shit no body cares about, just memorize this
Phase encoding direction —> AP —> pulsation artifact
Shorter
Frequency encoding direction —> side to side —> white-black-white-black
Note phase and frequency encoding directions will be opposite in breast, the above is only for body imaging
Fibrolamellar HCC
Seen in younger patients (20-30 yos) who are otherwise healthy (i.e. - no cirrhosis)
Therefore LI-RADS typically does not apply
Tend to be large 5-20 cm
Central scar with arterially enhancing periphery
AFP is normal
Prognosis slightly better than regular HCC
Biliary Cystadenoma/Adenocarcinoma
Middle aged women
2 flavors
With ovarian stroma
Without ovarian stroma
Can be any size but usually large when found
Basically a uniloculated or multiloculated fluid collection that has variable characteristics based on content
Looks like a giant simple cyst or some fucked up cyst
No overt communication with the ducts
Cannot differentiate between adenoma & adenocarcinoma based on imaging alone
Solid Lesions
Hepatic Adenoma
Discontinuous pseudocapsule
Many but not all will drop out on out of phase
Contain glycogen and fat
Like to bleed
No Kupffer cells
Seen in
Estrogen use
Glycogen storage disease
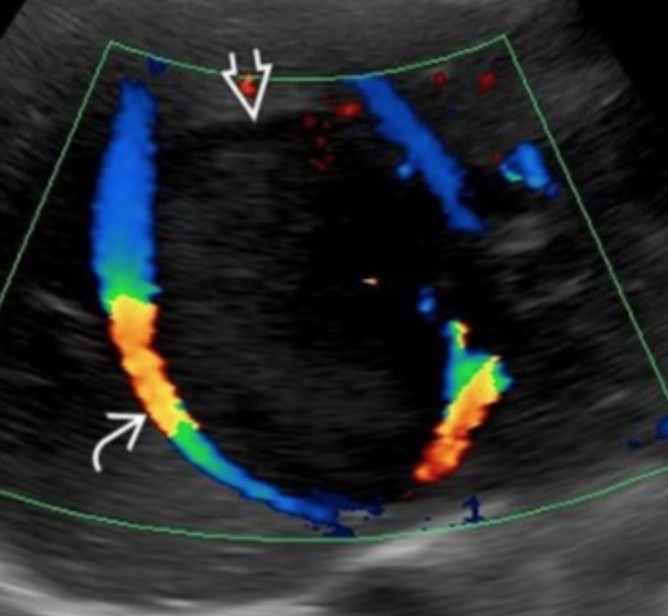
On US classically has large peripheral vessels and internal flow varies
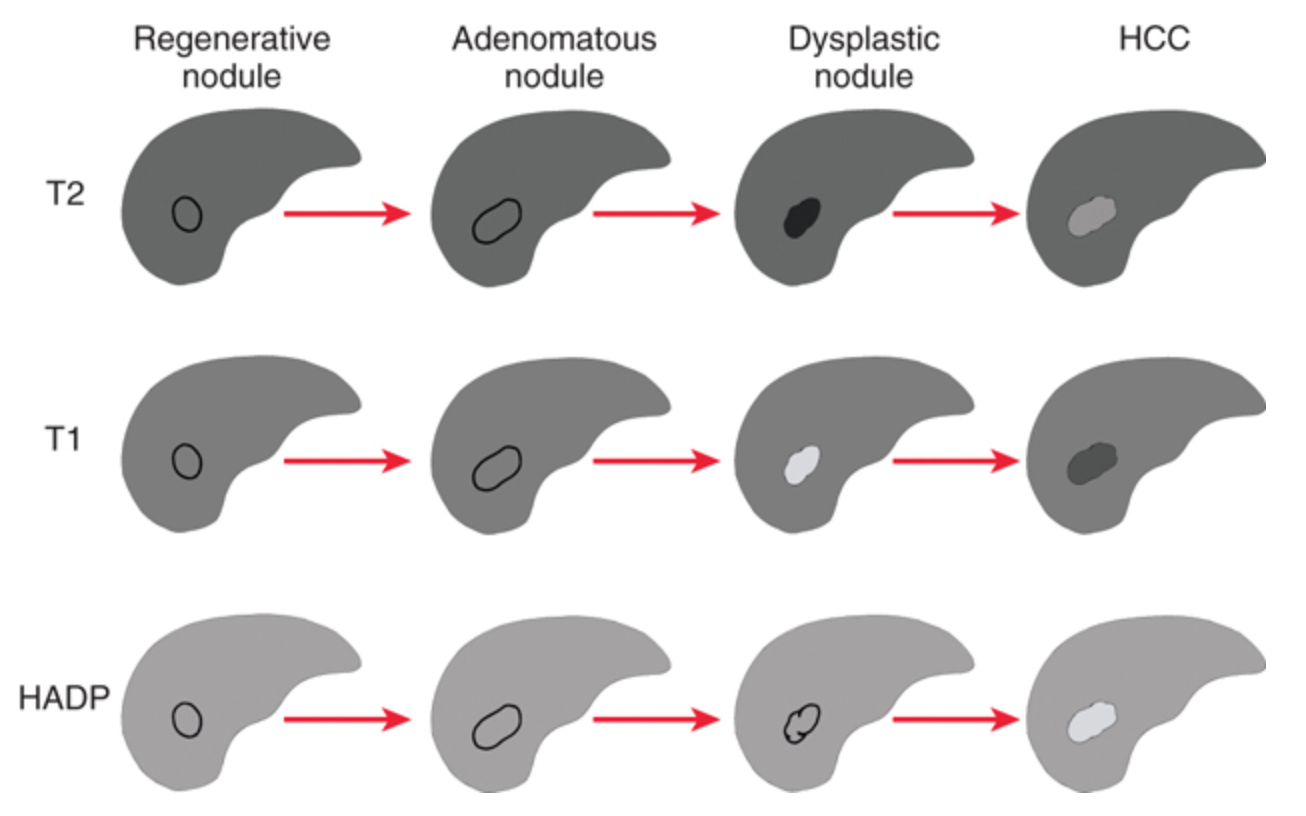
Liver Nodules
A fucked up liver will try and heal itself by making regenerative nodules
If you keep insulting the liver the regenerative nodules become dysplastic nodules
If you keep insulting the liver the dysplastic nodules become HCC
Biliary Cystadenoma
Cystic, multiloculated lesion
Can have areas with different signal within it (looks like more smaller cysts inside of large cyst) due to proteinaceous content
Focal Nodular Hyperplasia
Strong arterial enhancement
Fades to isointensity on venous and delayed phases
Central scar - should enhance gradually and be hyperintense on delayed phases
Not all cases have this
Reticulated/lace pattern hyperintensity on delayed imaging with gadolidium based agents
Malignant Masses
Dysplastic Nodules
Liver trying to heal itself basically and forms a regenerative nodule which contains normal liver cells
A regenerative nodule which has atypical cells is a dysplastic nodule
T2 hypo
Will become iso to hyper over time as it becomes more malignant
T1 hyper
Will be hypo over time as it becomes more malignant
Enhancement similar to or less than liver signal, not hyperenhancement (not brighter than liver)
Focal hyper-enhancing nodule in the larger overall nodule = nodule in nodule appearance
On CT looks like what you think congestive hepatopathy looks like with lace-like fibrosis type shit
Regenerative nodules seen in primary biliary cirrhosis too
Nodular regenerative hyperplasia
Typically seen in response to budd-chiari
Large regenerative nodules
Hypodense rim and central scar, strongly resemble FNH
Typically multiple
Benign
Pyogenic Abscess
Presents as multiple small heterogenous lesions that coalesce into one big heterogenous fuck
Pseudo-cirrhosis
Liver looks cirrhotic but not caused by regular cirrhosis
Patient with cancer and mets to liver gets treated for the cancer and causes masses to shrink and tissue to die and it causes retraction and nodular appearance of liver
Infectious Liver Lesions
LI-RADS
When can it be used
Must be an adult
Cirrhotic patient
Chronic Hep B infection
Hx of Hcc or prior Hcc
3 groups of patients
Group 1
Normal exam - surveillance in 6 months
LI-NC - exam is not satisfactory basically - repeat exam within 3 months
Hepatocellular Carcinoma
Most common primary hepatic malignancy
Believed to occur by chronic degeneration of a cirrhotic nodule that keeps getting more irregular
Key finings
Arterial hyper-enhancement
Washout
Enhancing capsule
Interval growth (>50% growth within 6 months of prior exam)
References: