Neurologic Ischemia
Great video where many of the images come from linked here.
CT Perfusion
Contrast is given and multiple images are obtained over a short period of time
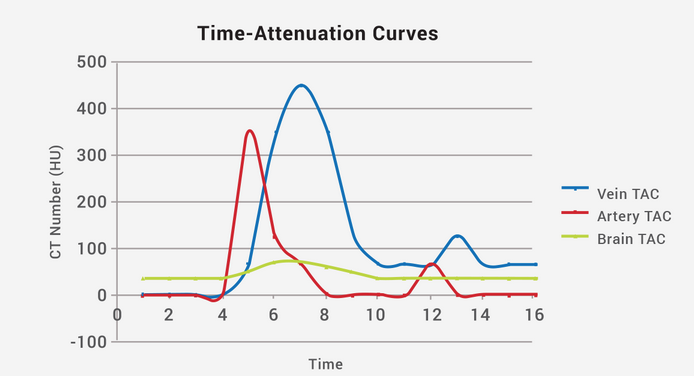
The density of the contrast can then be charter on a Time-Attenuation chart
Regions of interest in an artery, vein and brain parenchyma are evaluated each with their own curve
As time increases, attenuation should also increased to a peak because contrast continues to fill the vessels, then it will drop as the contrast is cleared out
Arterial peak will be first, then venous. The brain parenchyma curve is non very impressive compared to the vasculature curves because if you think how bright arteries look on arterial phase = high attenuation. If you think about how bright the brain gets during arterial phase it will be slightly brighter (hyperattenuating) but its is still not that different from normal brain parenchyma.
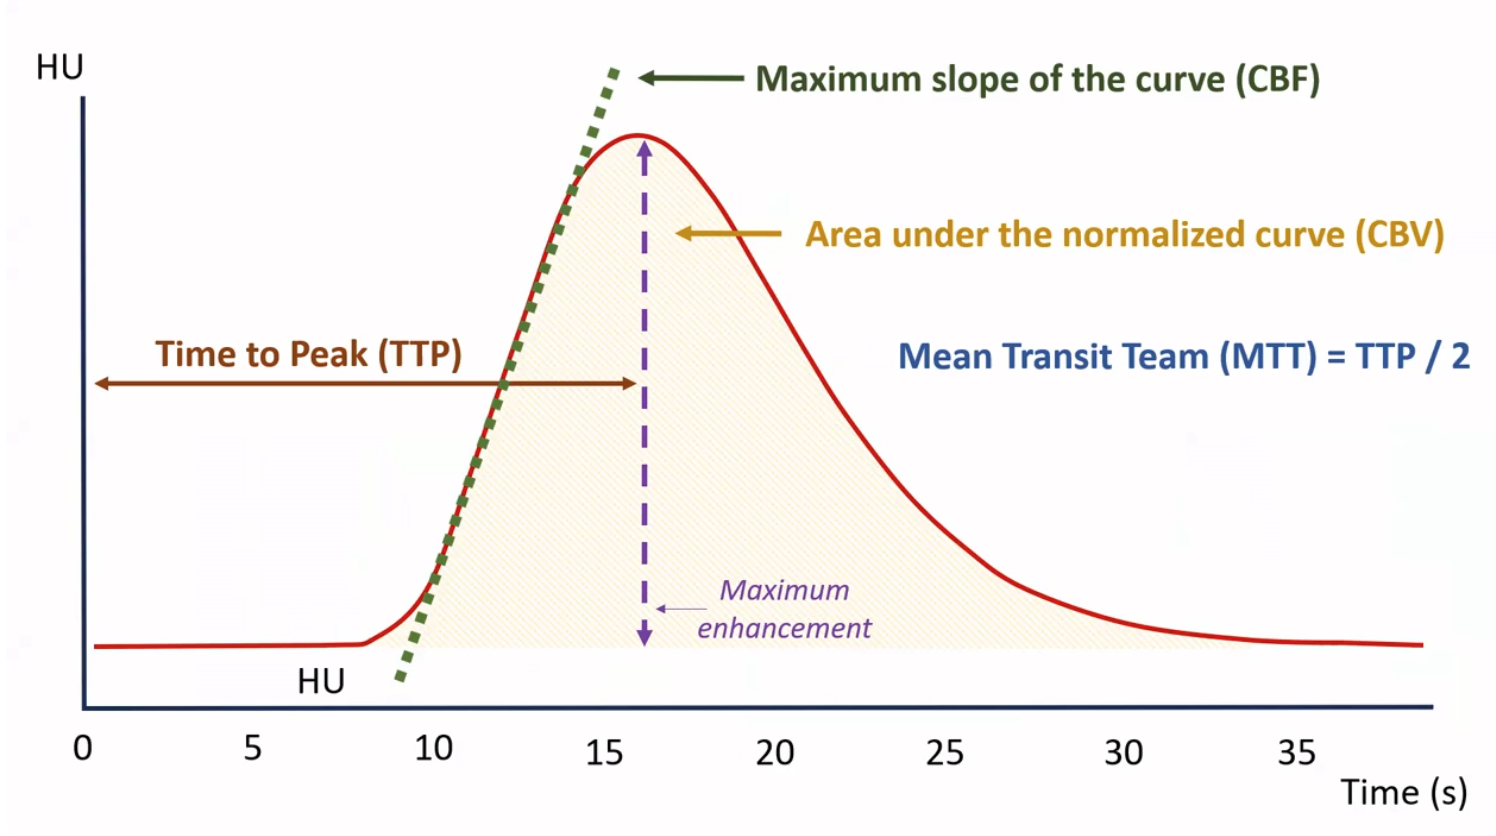
Slope of curve = CBF
Areas under curve = CBV
Two Major ways the fancy color images are made
Maximum slope model - projection
Assumes venous concentration of contrast is 0 (contrast is only in arterial system or brain parenchyma)
Deconvolution
Whole bunch of math shit, who cares?
Major Metrics
CBV = Cerebral Blood Volume = Amount of blood (measured in volume) in a piece of brain tissue at a single moment in time
CBF = Cerebral Blood Flow = How much blood is flowing through a piece of brain tissue over a period of time
MTT = Mean Transit Time = Average amount of time it takes for RBC to cross a cerebral capillary
Time to peak = time between contrast administration and peak attenuation
CBF = CBV/MTT
This should make sense because CBV is measured in volume (ml), MTT is measured in time (s) and CBF is measured in volume/time (ml/s)
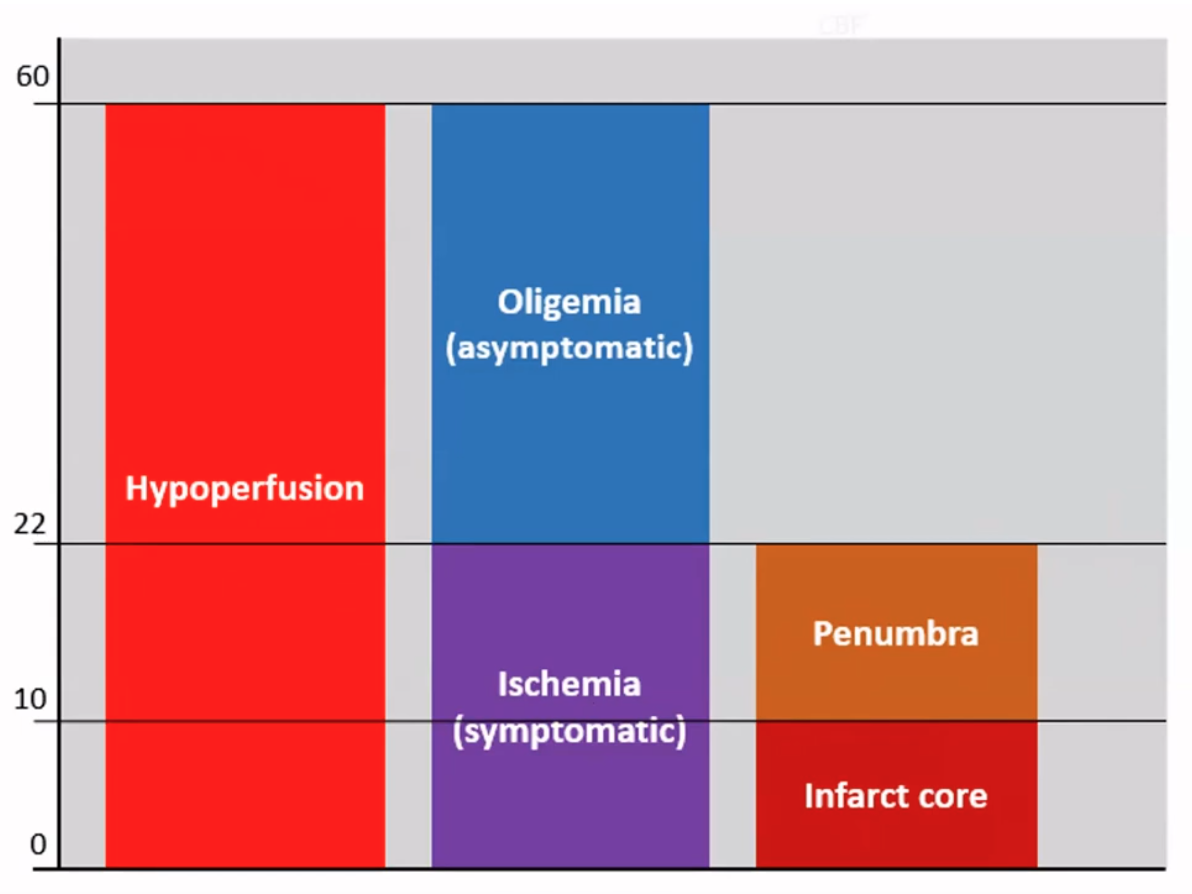
Use the following graph below to walk through approach to reading CT perfusion studies:
Start with MTT - will be increased in all forms of ischemia
Then look at CBF
If normal —> simple oligemia
If decreased —> look at CBV
Now look at CBV
If normal —> penumbra
If decreased —> core infarct
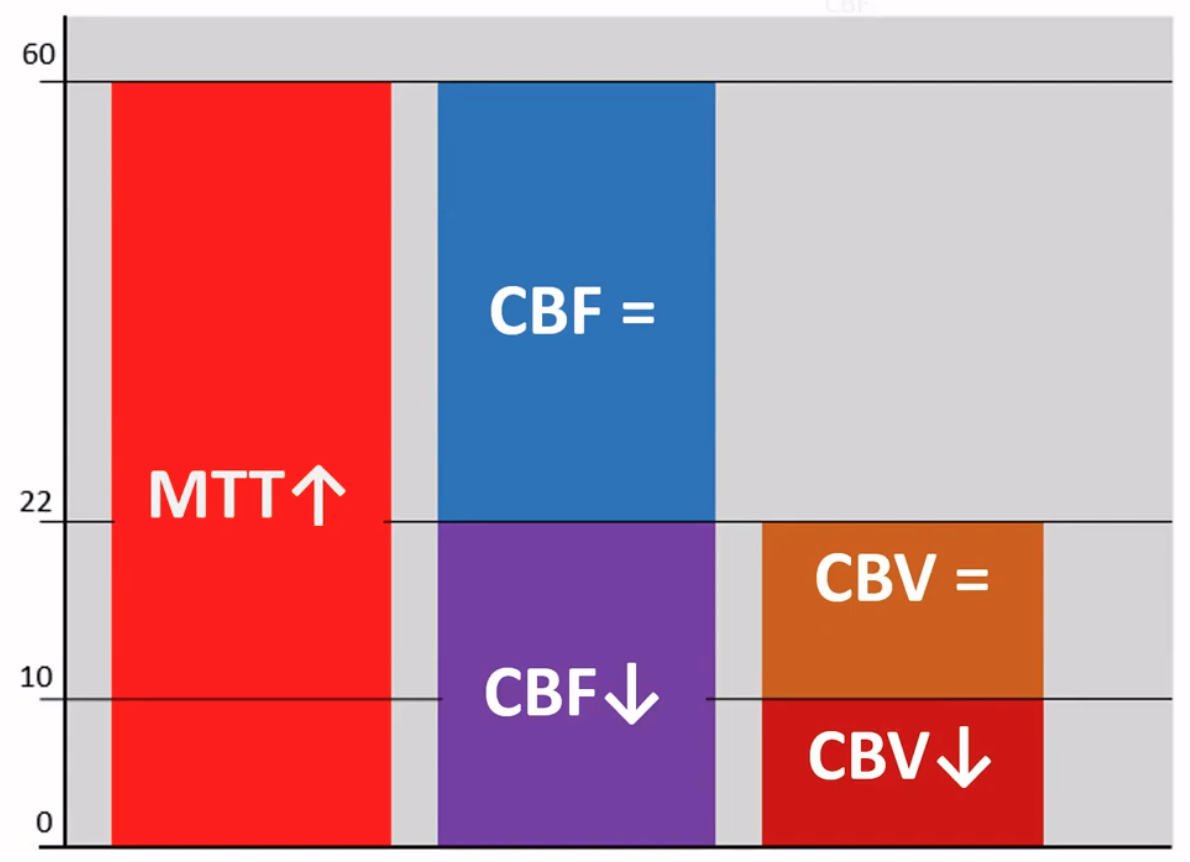
Ultimately:
If ↑ MTT + normal CBF —> oligemia
If ↑ MTT + ↓ CBF + normal CBV —> Penumbra
If ↑ MTT + ↓ CBF + ↓ CBV —> Core infarct
Note it is not always cut and dry and there can be areas that have decreased CBV (core infarct) and surrounding areas with normal CBV, this is what is meant by core infarct with surrounding pneumbra